PROJECT:
Bachelor's Thesis (B. Sc. User Experience Design)
TOPICS:
UX Research, UI Design & Branding, Frontend Developoment
DURATION:
June – November 2024
TOOLS:
Figma, React, Tailwind CSS, Miro, Canva, Vite
TESTING
Cognitive Walkthrough + Remote Usability Testing (n=7)
Feldschau
A User-Friendly Platform for AI-Based Plant Stock Evaluation
about.
With rising food insecurity and a growing world population, plant breeders need efficient tools to assess crop performance.
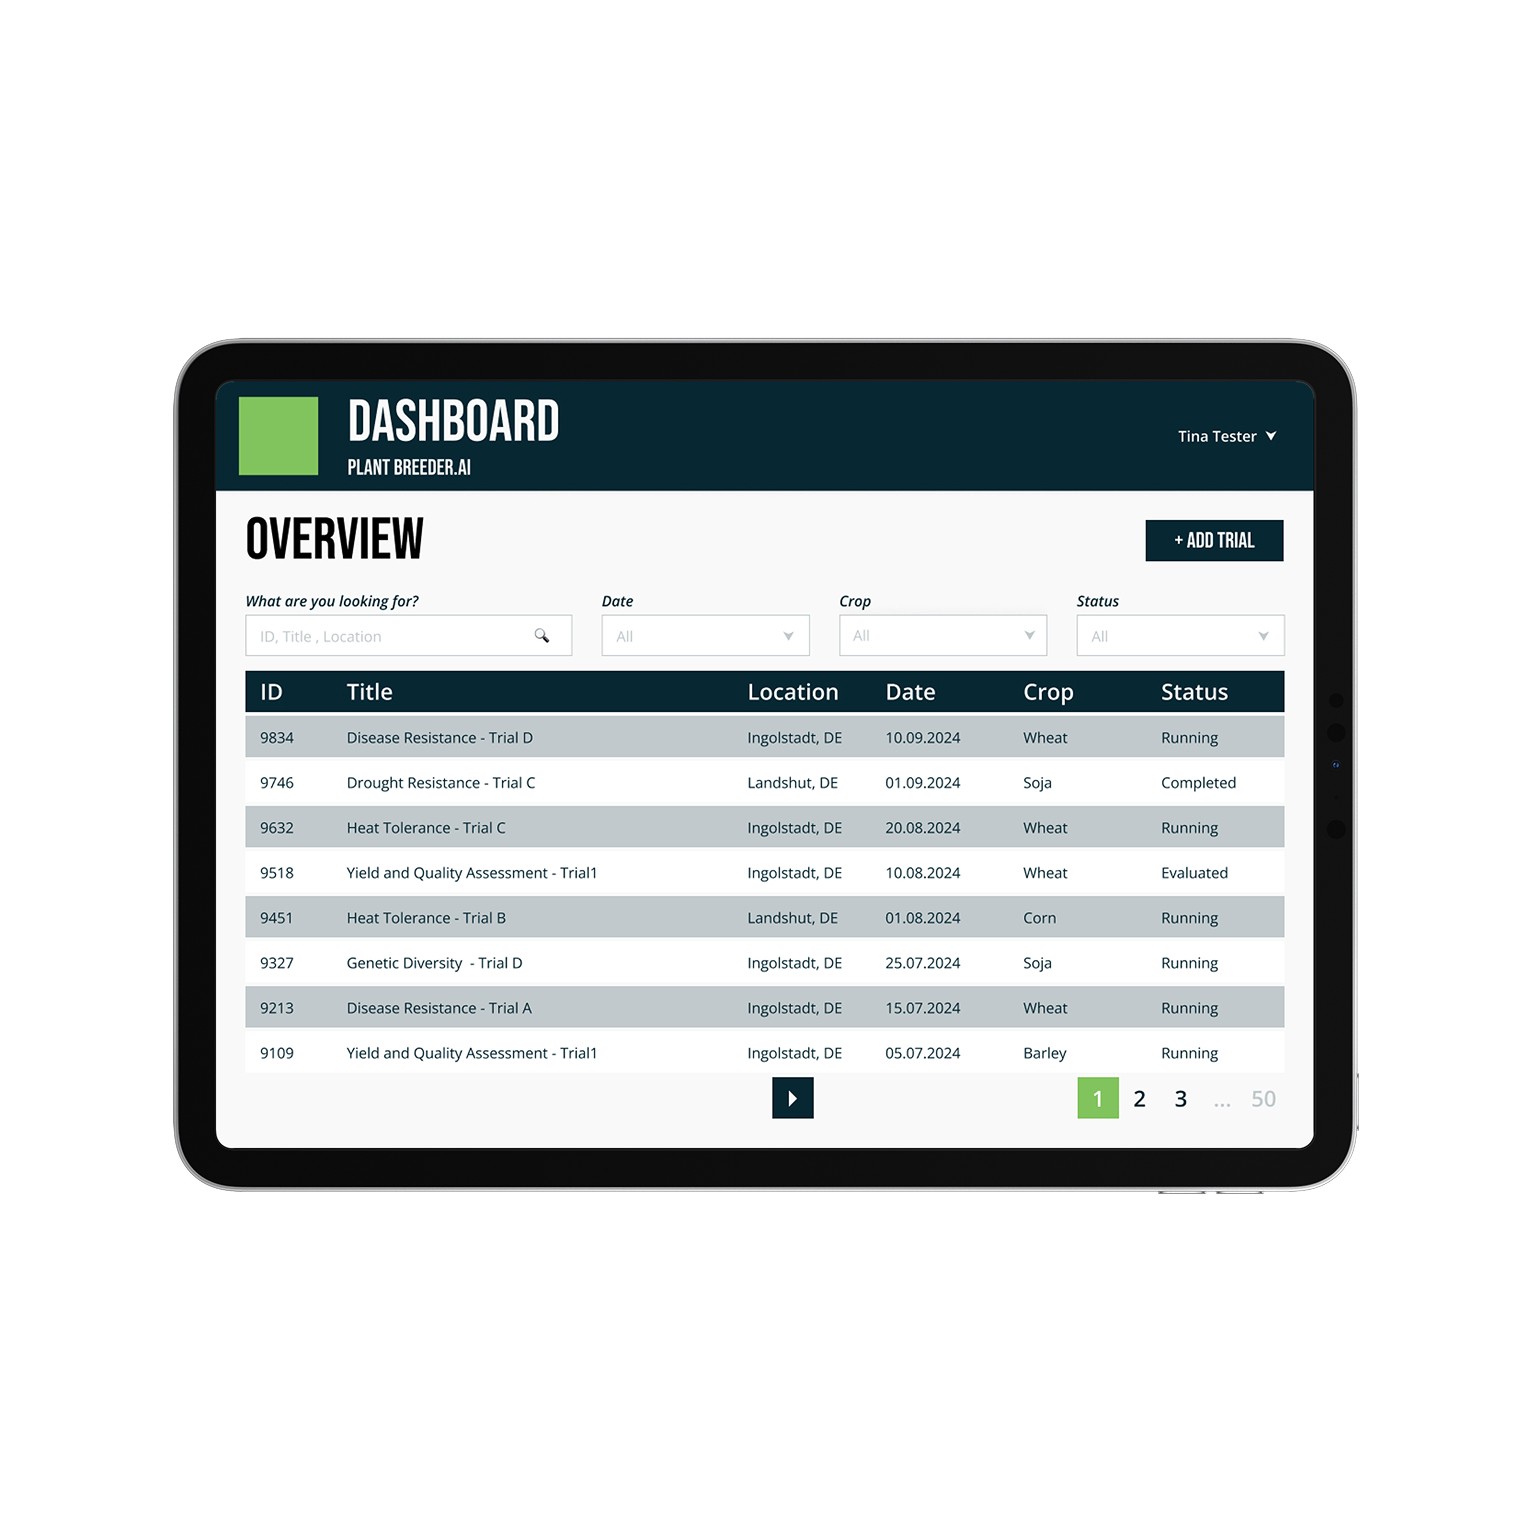
Feldschau.AI is a web platform designed to support AI-powered evaluation of wheat spike data, helping breeders make faster, data-driven decisions — without replacing hands-on fieldwork.
The challenge was to make advanced AI technology accessible to a non-tech audience in agriculture.
solution.
Feldschau.AI provides:
A dashboard-based platform for breeders to manage trials and view results
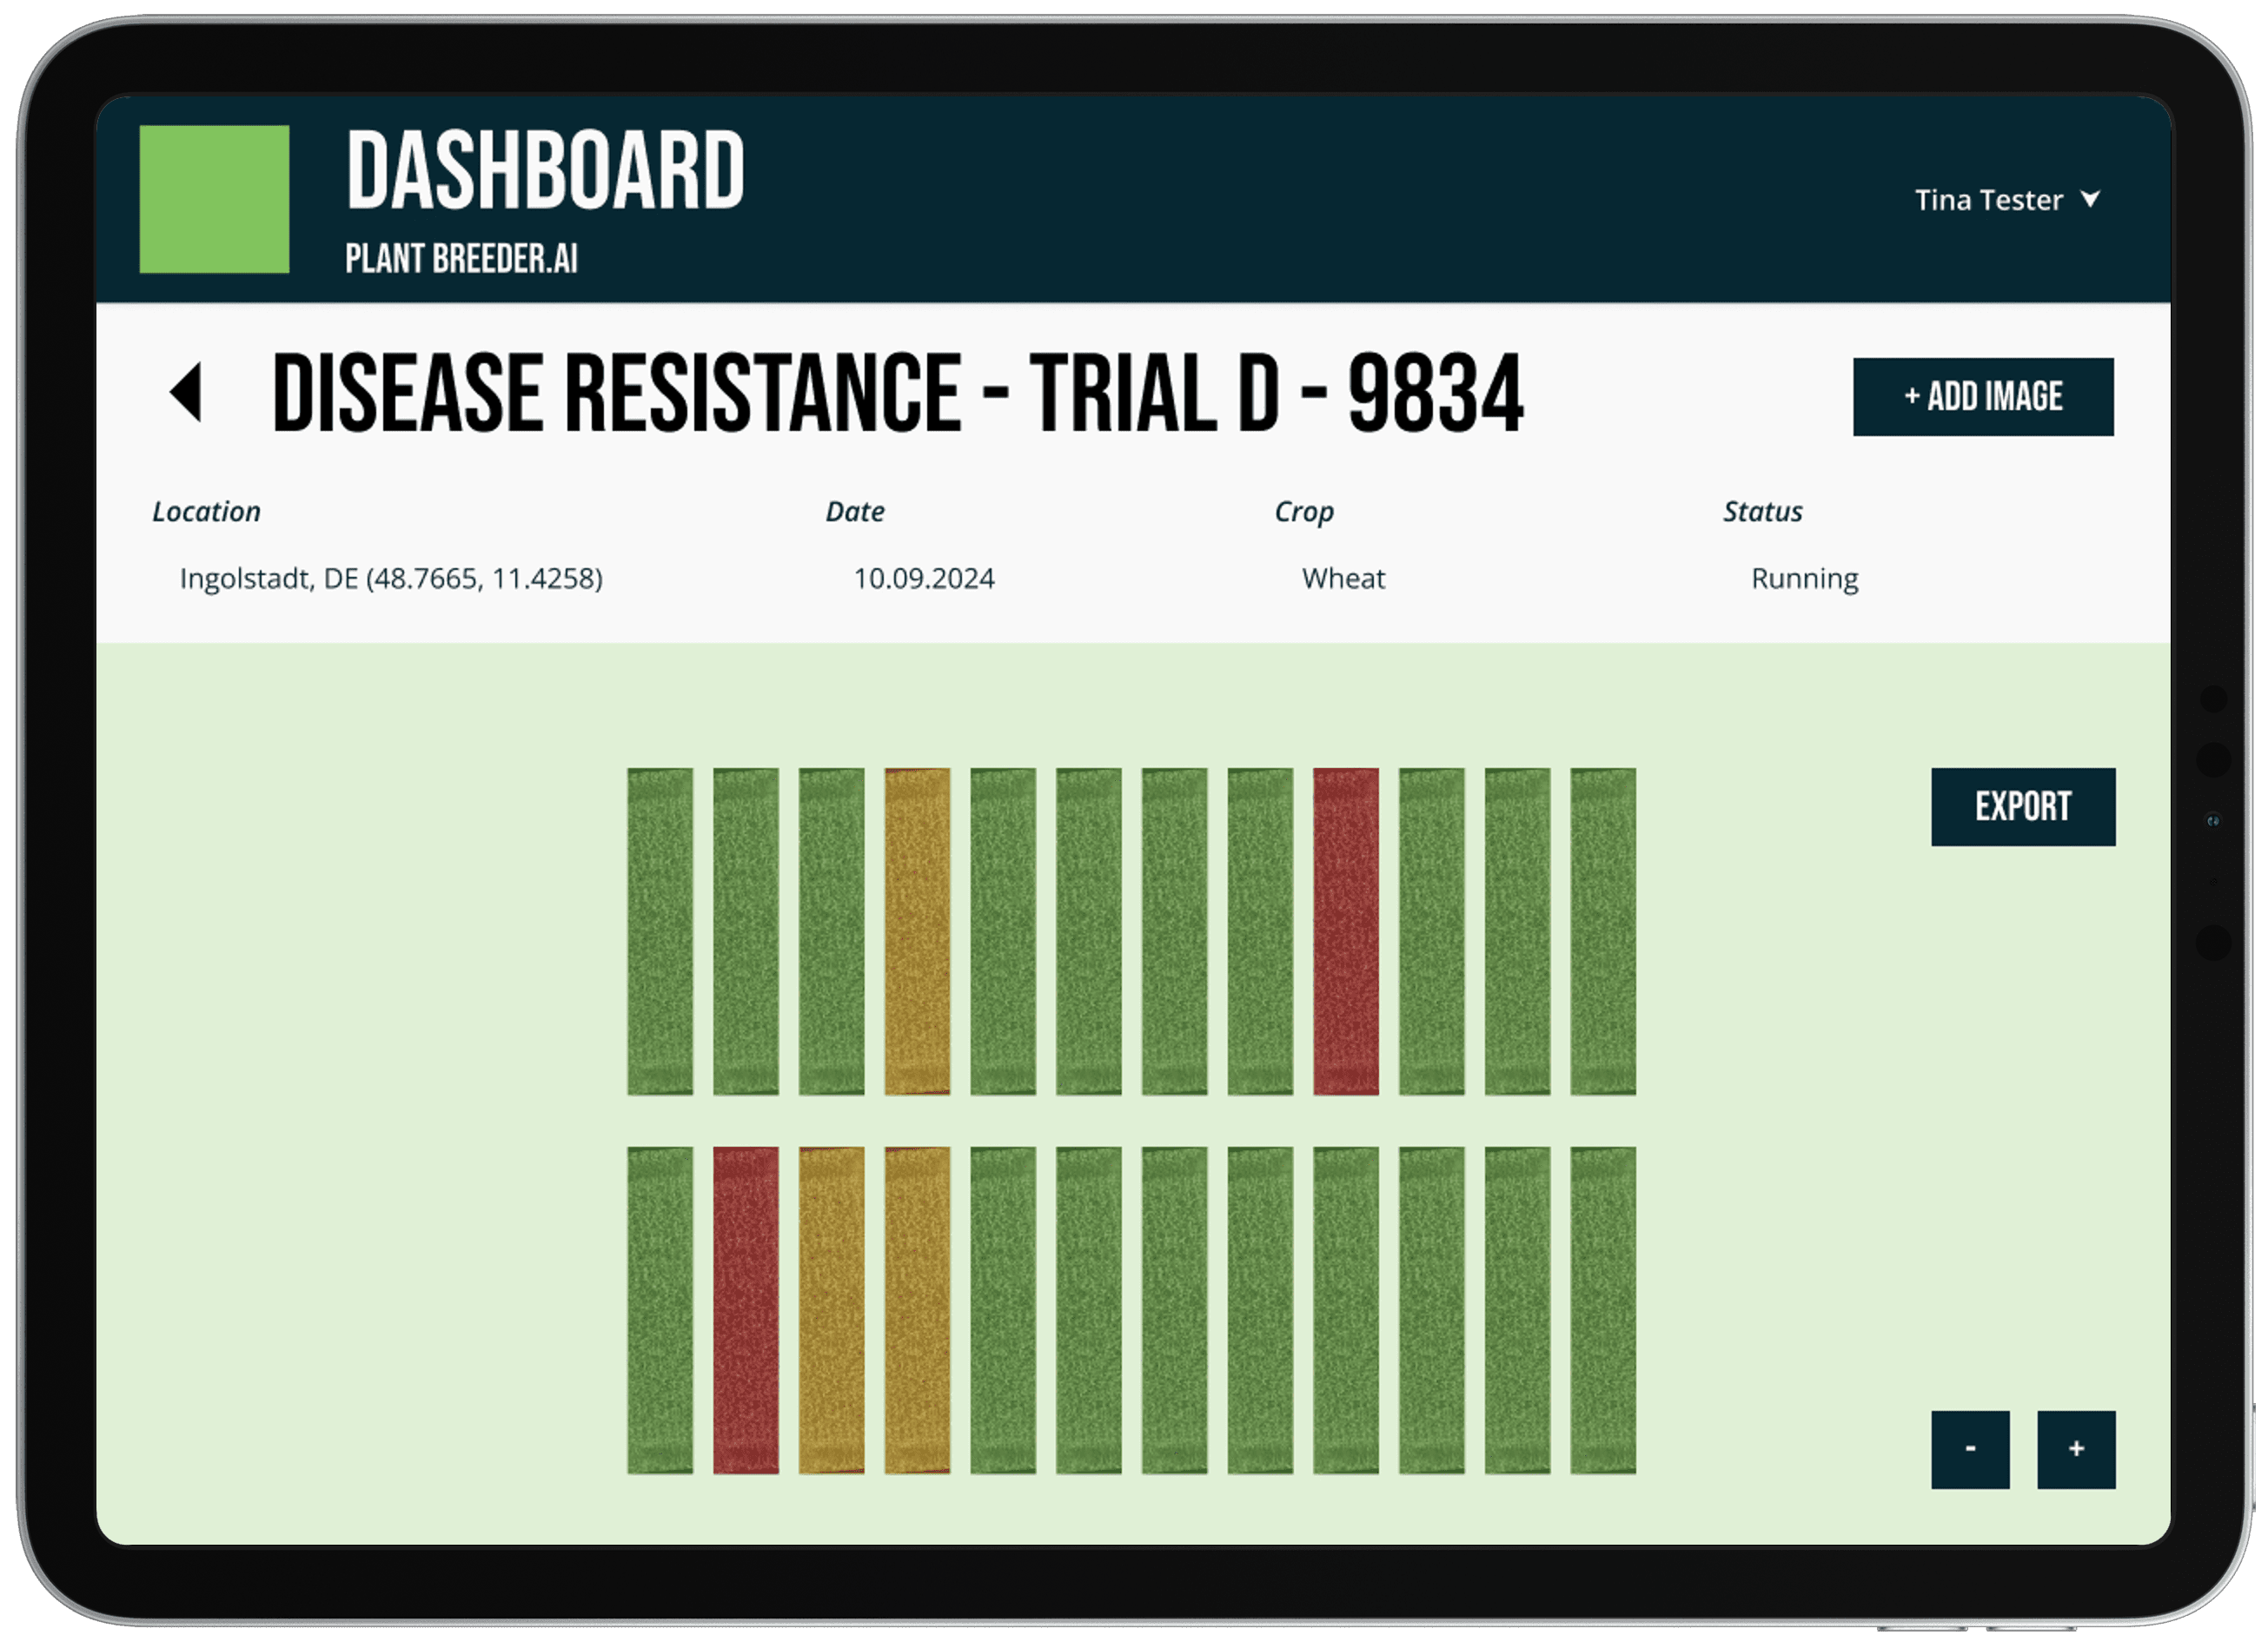
AI-generated visual feedback on images of crop trials
Support for trial data management, image uploads, and score filtering
A responsive design tailored for tablet use in the field
human-centered design.
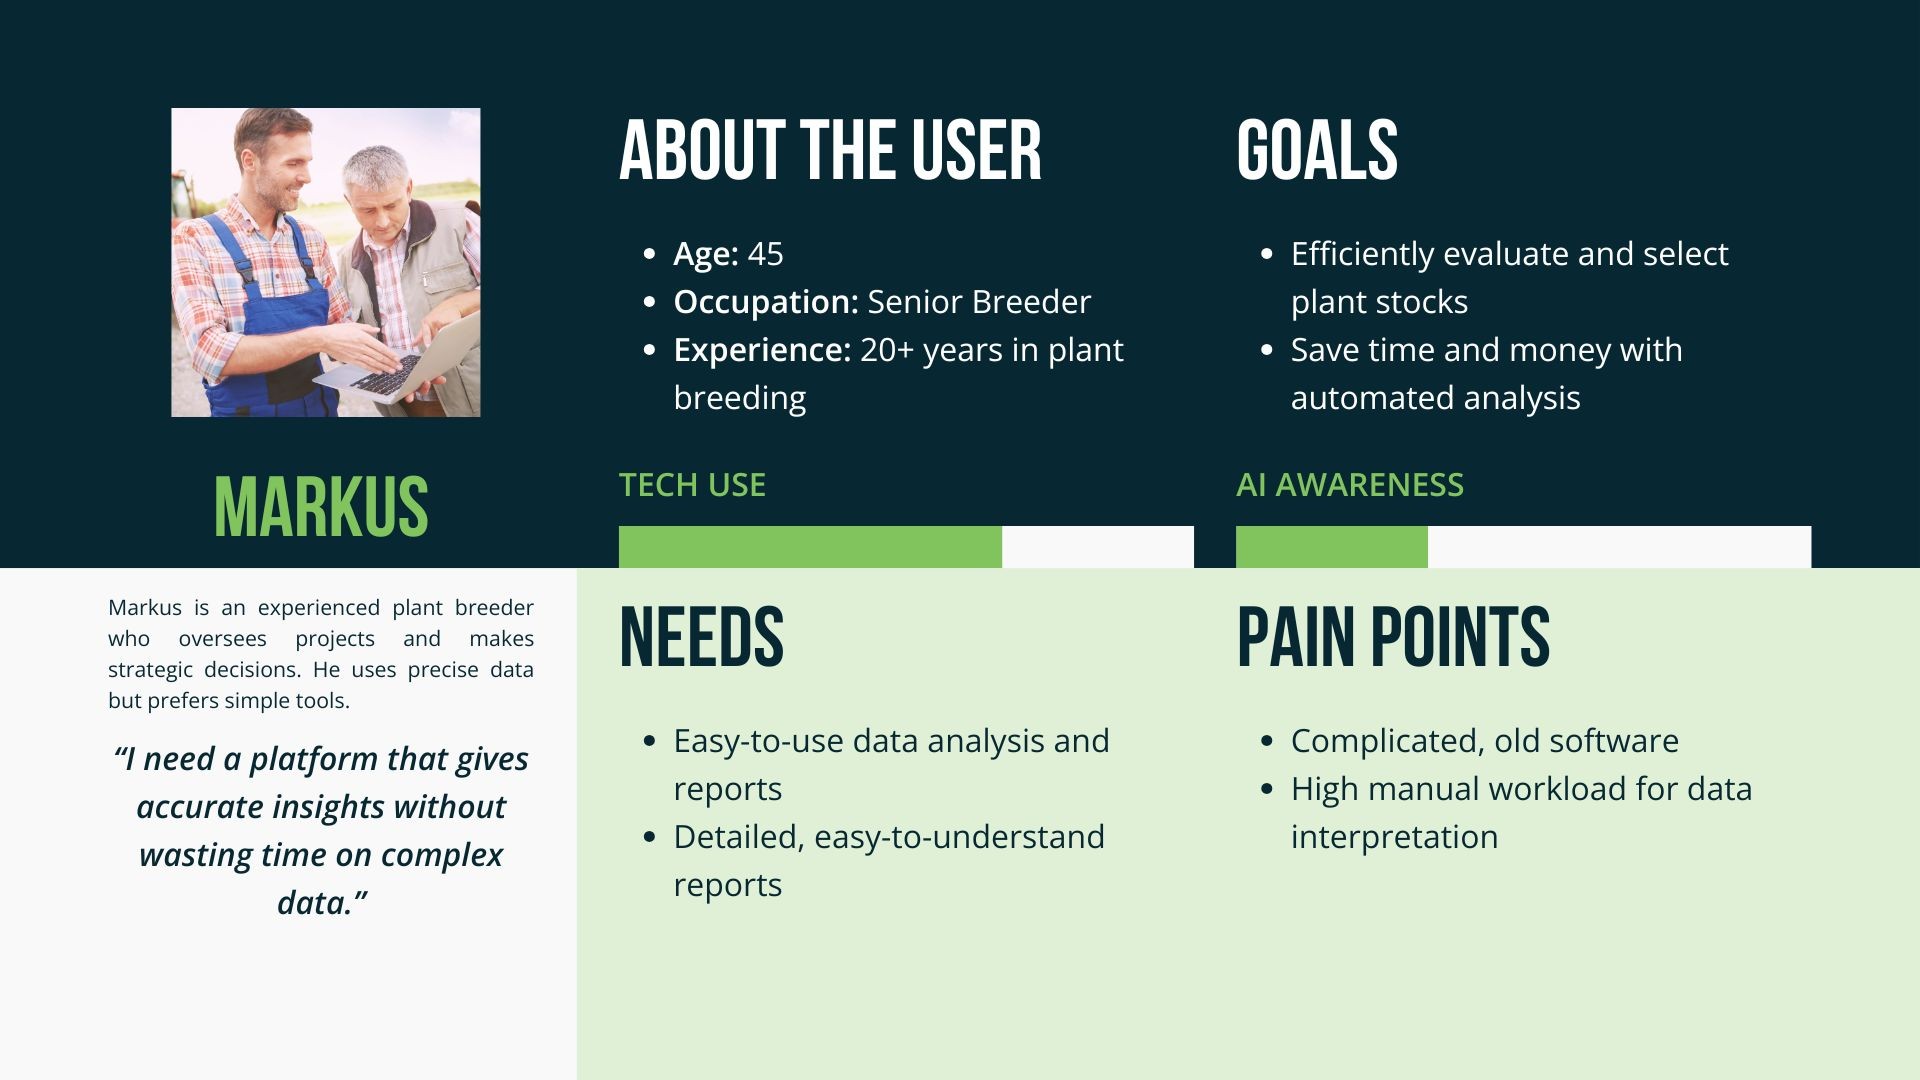
Through a user-centered process, I interviewed experts, developed detailed personas (e.g., "Markus – the senior breeder"), and derived critical needs: simplicity, transparency, and efficiency.
The platform helps breeders evaluate, compare, and export plant trial data - while keeping them in control.
process.
Research: Competitor analysis & expert interviews
Personas & User Requirements: Needs translated into concrete features
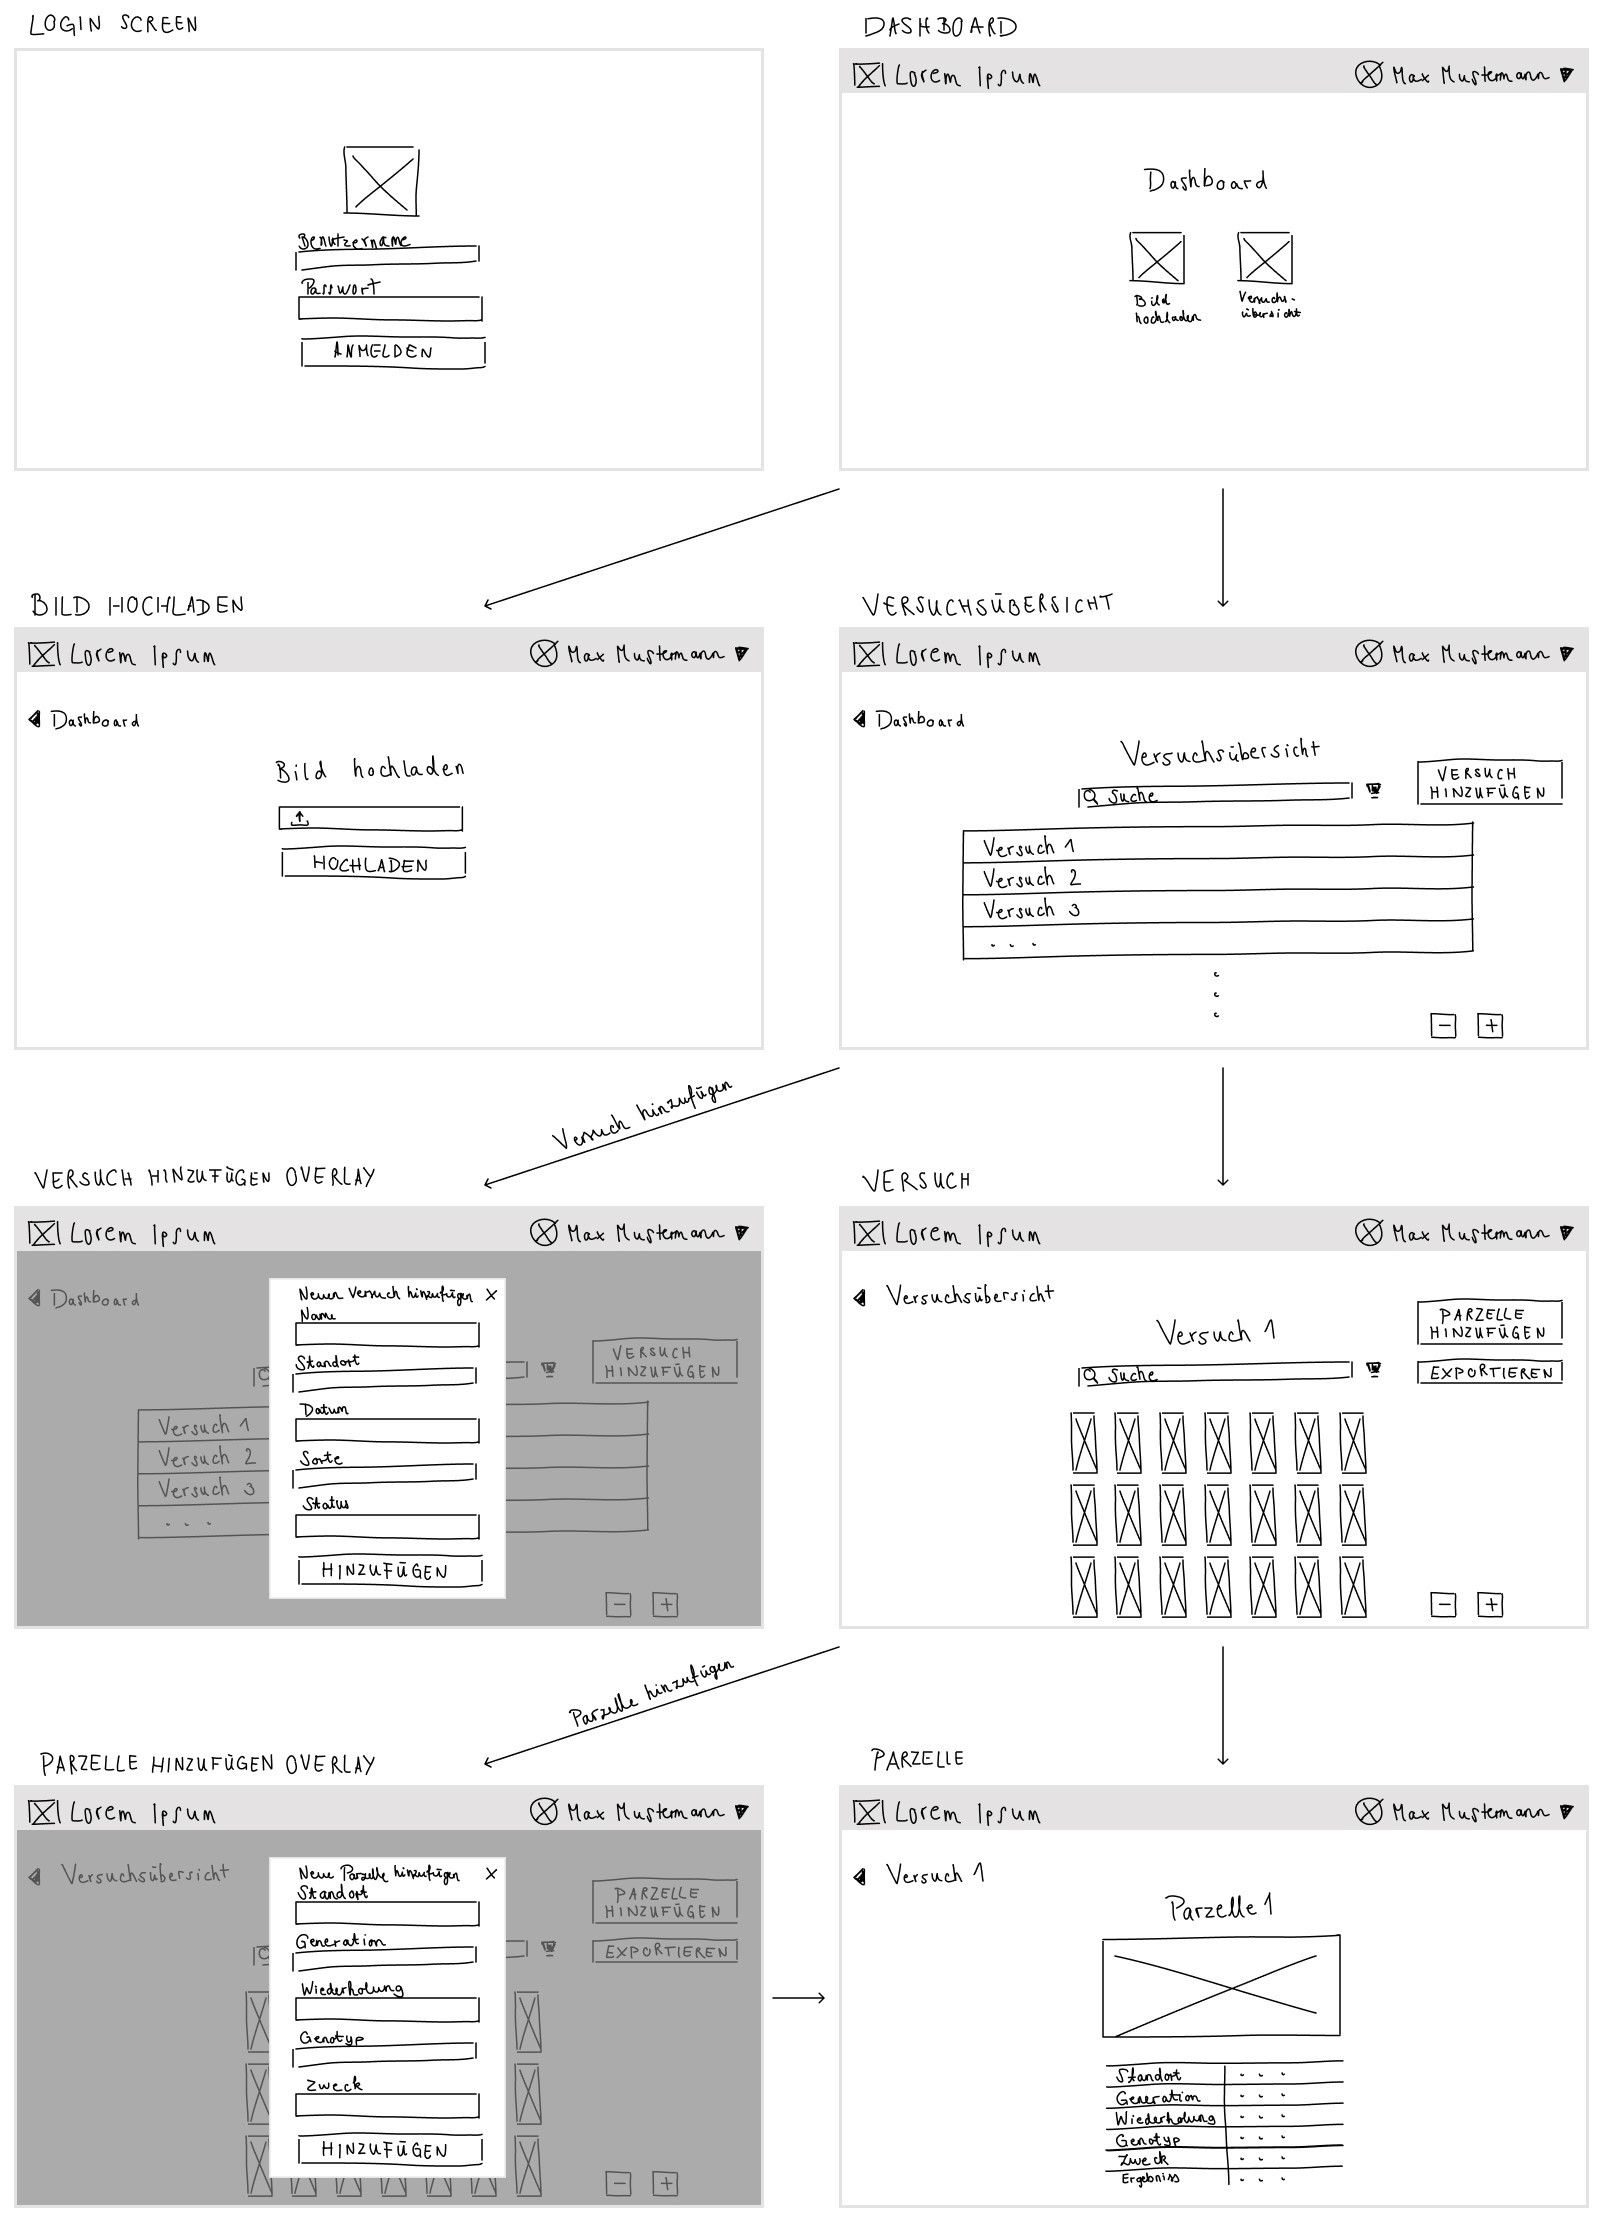
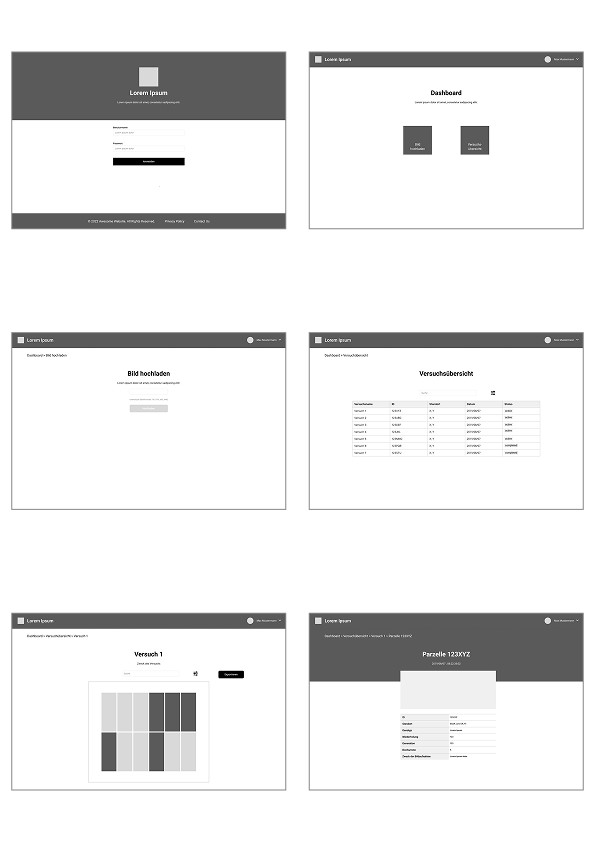
Concept Development: Scribbles → Wireframes → Lo-Fi prototype
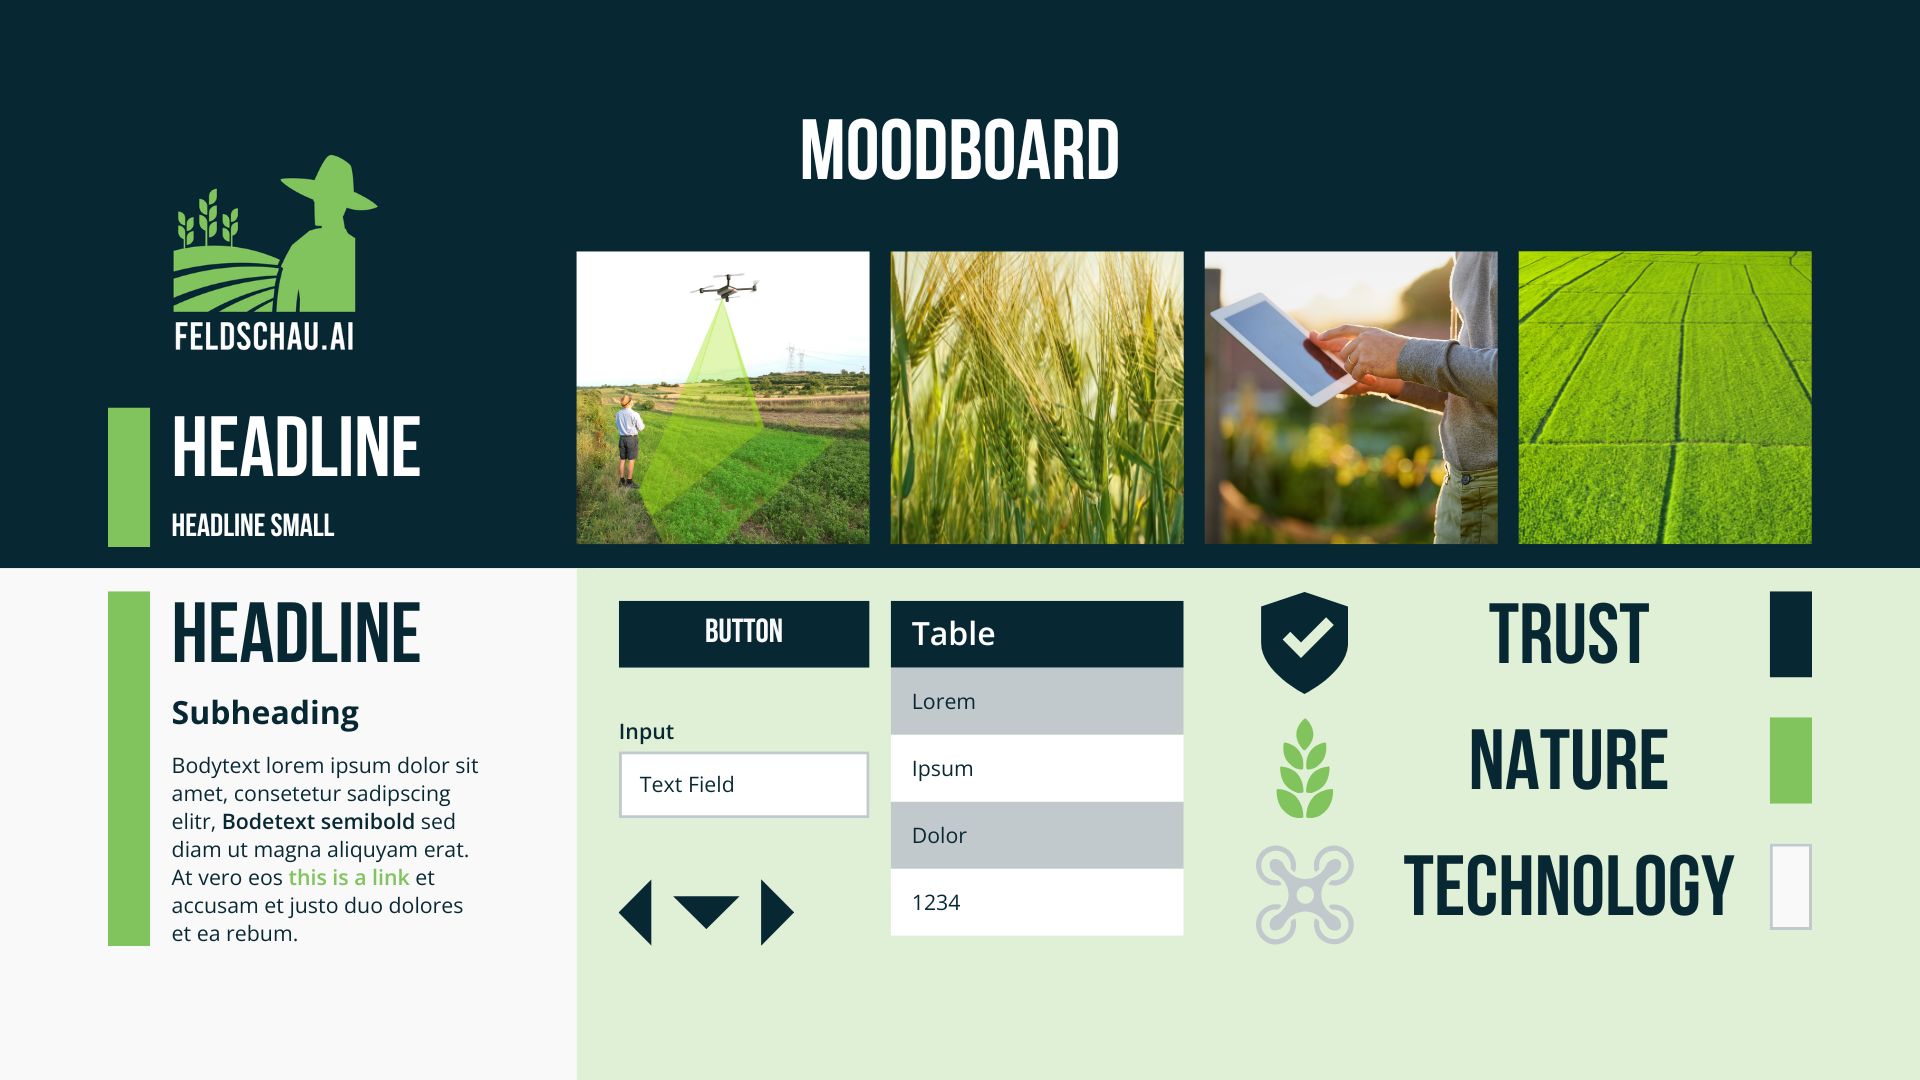
UI & Branding: Moodboard, design system, and Hi-Fi prototype in Figma
Usability Testing: Remote testing with real plant breeders (Reddit community)
Implementation: Developed frontend in React + TailwindCSS, using localStorage for demo functionality
result.
While breeders are open to AI, they demand transparent results and prefer tools that support — not replace — their expertise. Human-AI collaboration is key.
Outcome:
Fully implemented interactive prototype (React frontend with simulated data)
Demo video showcasing user flow, core features, and interface design
SUS Score: 84.64 (Excellent usability)
Design praised for intuitive flow, responsive layout, and clear data visualization
Usability insights led to improvements in filtering, feedback clarity, and accessibility
